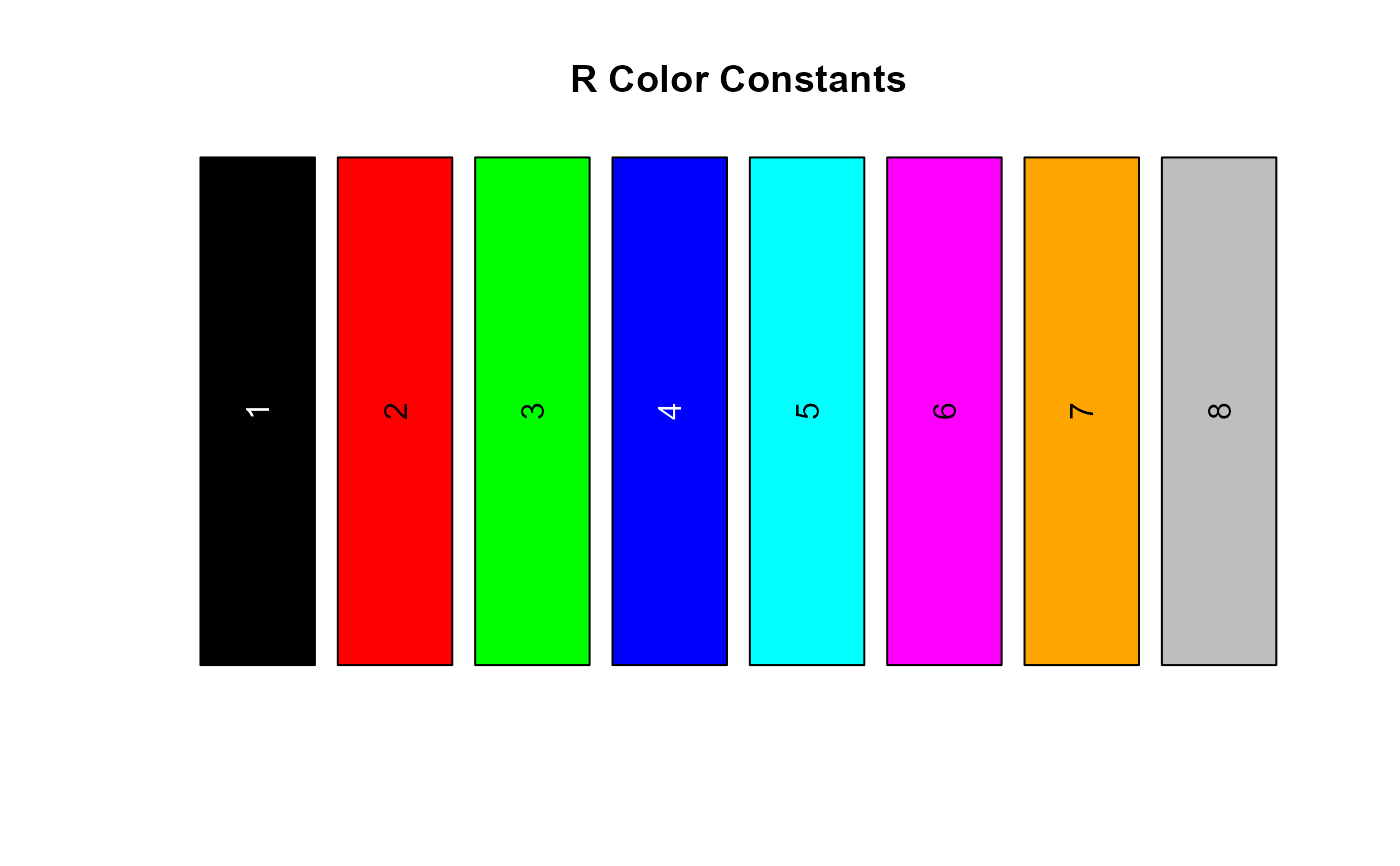
This function provides information that describes the color constants that exist in R
Details
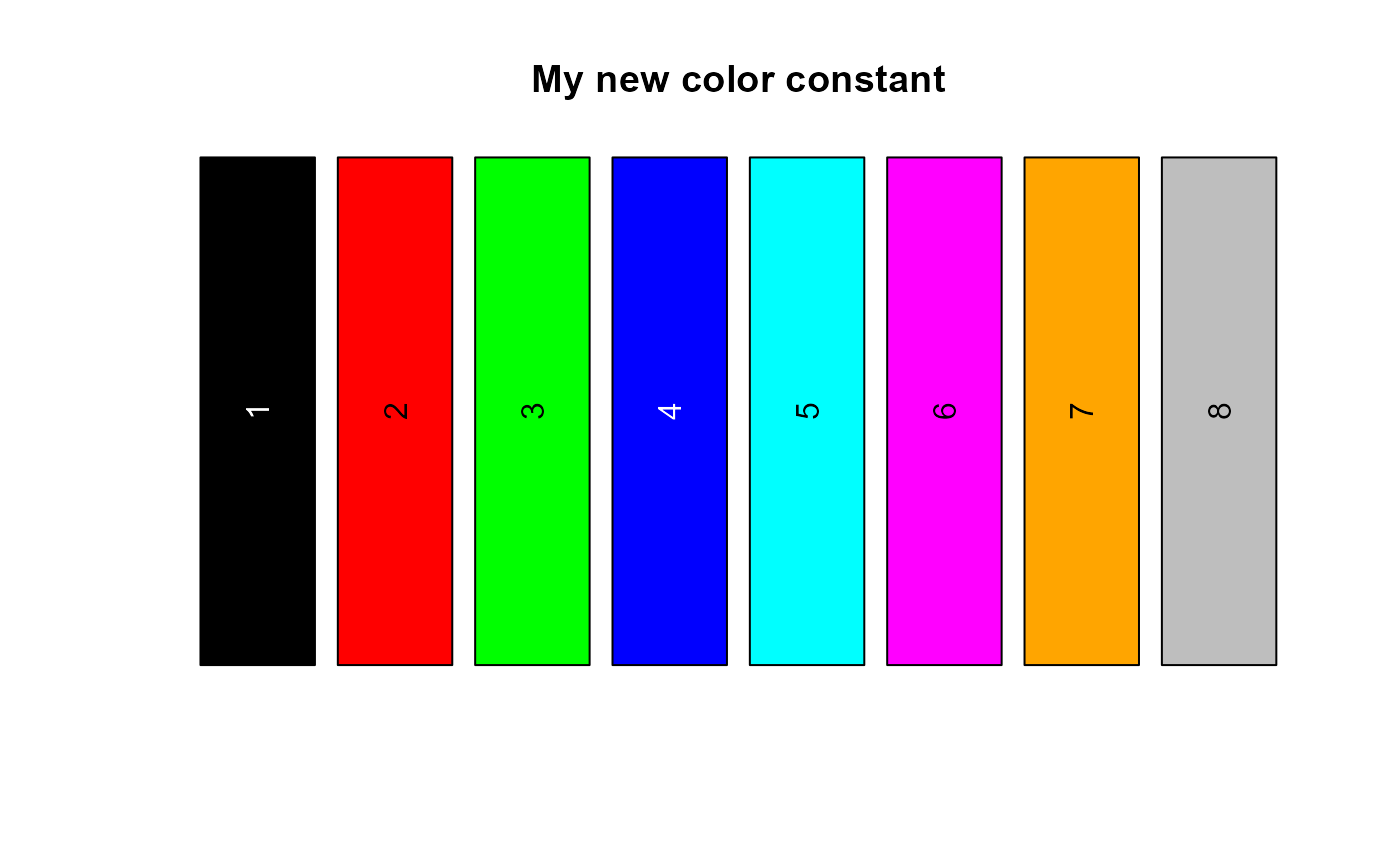
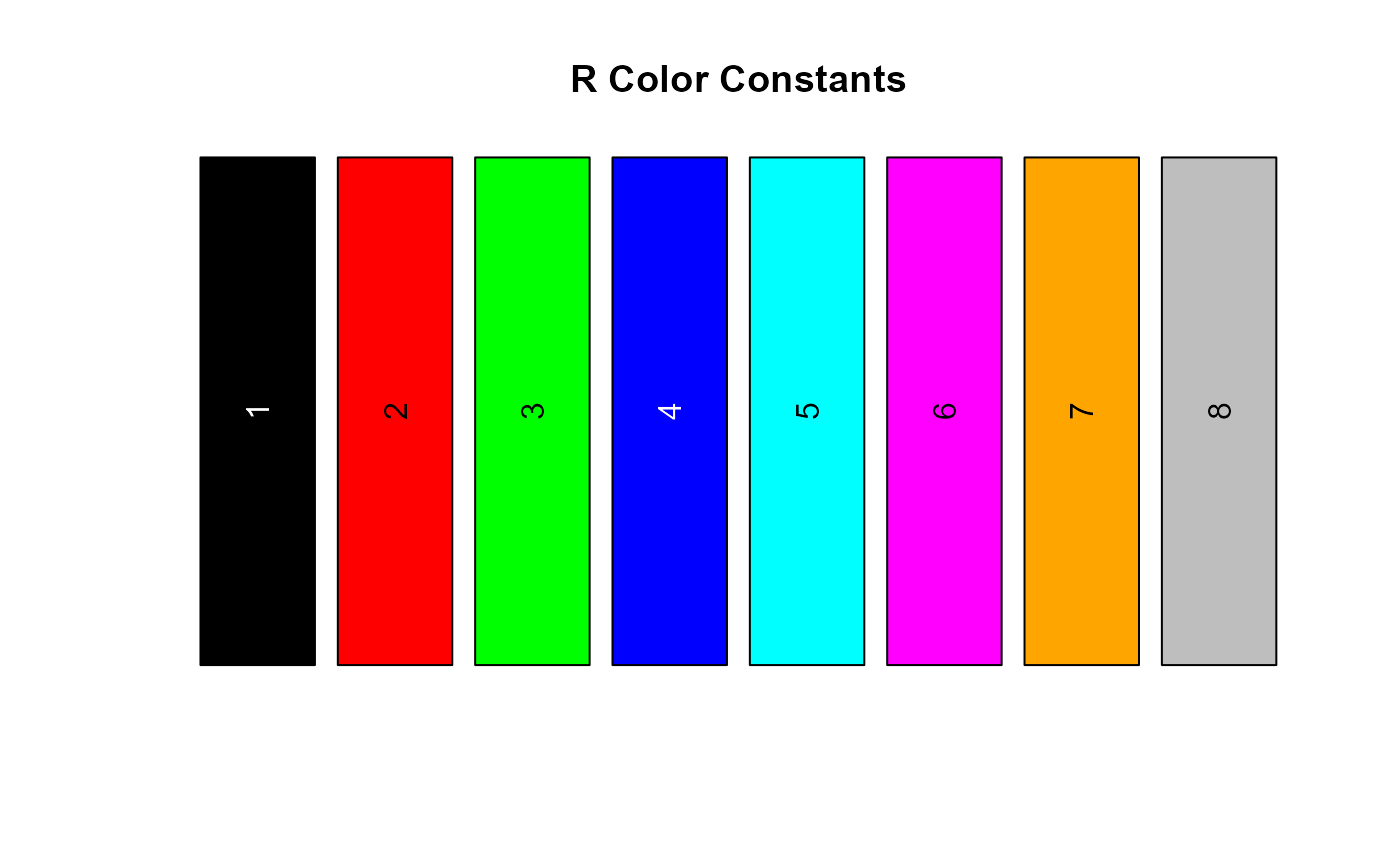
In addition to the color palette in R that can be represented as either color literals or hexadecimal values, numeric values can also be used to add colorization to a plot. Numeric values ranging from 1 to 8 provide 8 basic colors that can be deployed. The rcolorconst function returns both a Named Vector and a color palette plot that connects these numeric values with their corresponding color.
Examples
# Without title
ex1 <- rcolorconst()


# With title
ex2 <- rcolorconst("My new color constant")


# More detailed example
set.seed(200)
x = data.frame(
  meas = rnorm(100),
  grp = sample(1:8, size = 100,
  replace = TRUE))
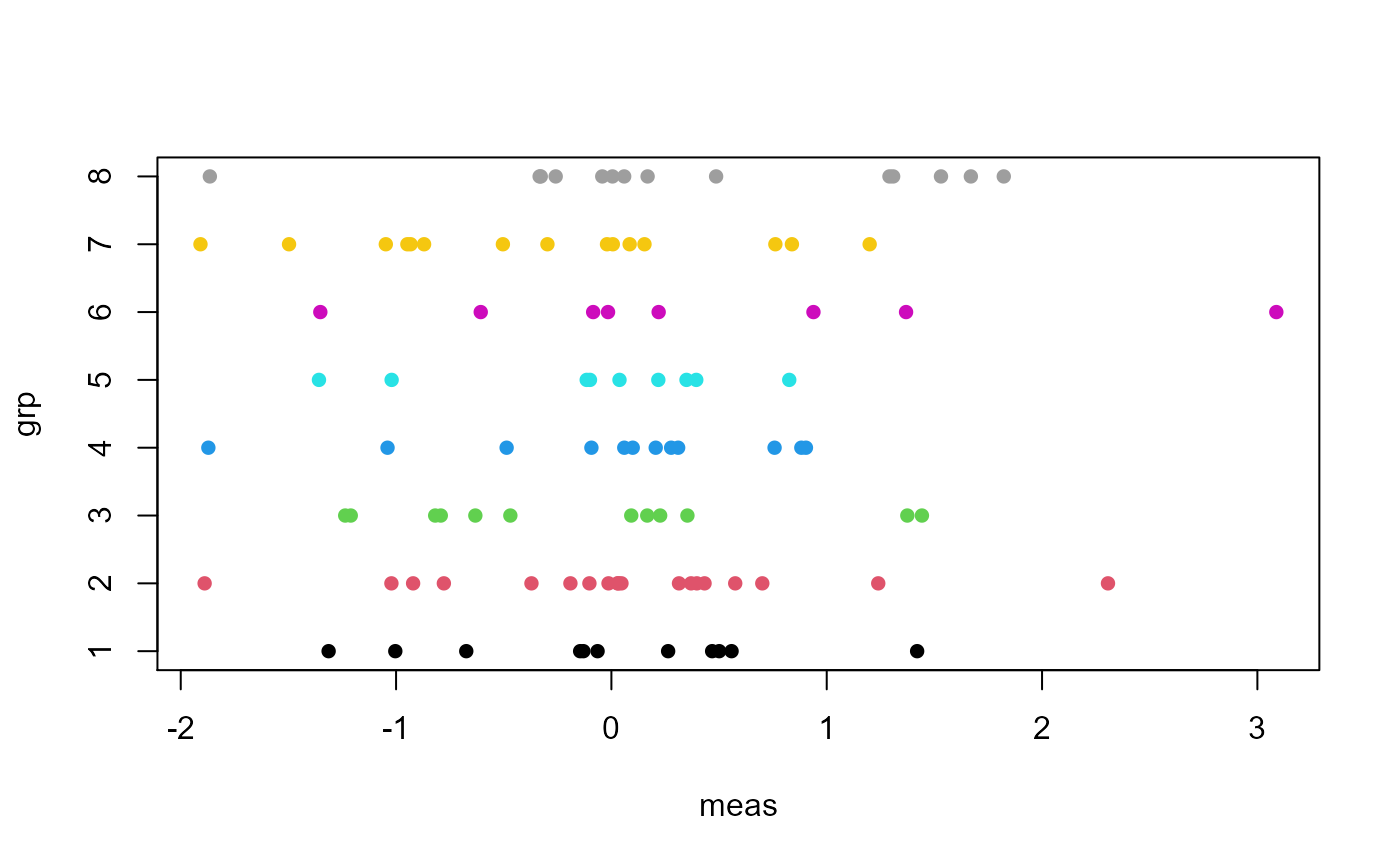
plot(x, pch = 16, col = x$grp)

colnums = rcolorconst()
